It was supposed to be simple
I wanted one thing: a map showing where my photos were taken. One pin per location, nothing clever, no surprise API bills at the end of the month.
Then I actually started building it.
The scope didn't blow up all at once — it crept. Every sensible addition unlocked another edge case. Clusters meant spiderfying. Popups meant mobile tap handling. Shareable state meant URL params. Two weeks later I had a real interface, which was not the plan, but here we are.
This is a build note, not a tutorial. I'm writing it down because I want the decisions and reasons in one place.
The constraints I set before touching any code
Before picking a map library I wrote down the rules, because I knew I'd talk myself out of them later:
- No paid map services
- Build-time geocoding1 so deploys stay deterministic2
- Cache everything to avoid repeated lookups
- One pin per unique location, even if there are ten photos from the same place
- Play nice with the site's theme toggle
The library choice came from the constraints, not aesthetics. I looked at MapLibre and MapTiler briefly — both fine — but React 19 compatibility was already a known rough edge and I didn't want to debug wrapper churn on top of building the actual feature. Leaflet is boring and predictable in all the right ways.
Tiles were a harder decision. Mapbox has beautiful styles but requires an API key and charges above a threshold I'd inevitably hit. I tried a few open alternatives and landed on Carto — they publish free attribution-only tiles with proper light and dark variants3. Exactly what I needed.
Where the data comes from
Every pin starts in data/site/captions.json:
[
  {
    "filename": "0087.webp",
    "caption": "Devils Punchbowl Falls, New Zealand",
    "title": "",
    "date": "2021 07",
    "location": "Devils Punchbowl Falls, Arthur's Pass, New Zealand",
    "tags": ["landscape"],
    "camera": "NIKON Z 8"
  },
  {
    "filename": "0088.webp",
    "caption": "Ben Ohau, New Zealand",
    "title": "",
    "date": "2021 12",
    "location": "Ben Ohau, New Zealand",
    "tags": ["landscape"],
    "camera": "NIKON Z 8"
  }
]
The location field drives geocoding. Everything else (filename, caption, tags, etc.) feeds the gallery and popup previews.
A small script reads all unique location values, geocodes them with Nominatim, rounds the coordinates, and writes results to data/site/location-coordinates.json. Originally I wired this into a Gatsby lifecycle hook so it ran automatically on every build:
const { syncLocationCoordinates } = require('./scripts/geocode-locations');

exports.onPreBootstrap = async ({ reporter }) => {
  await syncLocationCoordinates({ reporter });
};
That worked fine until it didn't. The hook ran on every cold build whether or not anything had changed, and it added latency I didn't want. I eventually moved it out of the build entirely — now I run npm run geocode:locations explicitly when location data changes. The cache is committed, so builds work offline once it's primed.
The nice part about that shift is that it's clearer. You decide when to refresh coordinates instead of hoping a hook fires at the right moment.
The geocoding code itself
const collectLocations = (captions) => {
  const unique = new Set();
  captions.forEach((entry) => {
    if (typeof entry.location === 'string' && entry.location.trim()) {
      unique.add(entry.location.trim());
    }
  });
  return Array.from(unique).sort((a, b) => a.localeCompare(b));
};

const roundCoordinate = (value) => Number(Number.parseFloat(value).toFixed(2));
Rounding to two decimal places keeps pins close enough for storytelling without sharing exact GPS coordinates. It also keeps the cache lean — same place, same rounded key, no duplicates.
The lesson I learned about location strings
Nominatim is good but not forgiving. This doesn't geocode:
Devils Punchbowl Walking Track, New Zealand
This does:
Devils Punchbowl Falls, Arthur's Pass, New Zealand
The difference is specificity. Poetic names, trail names, and vague references fail silently — they return a low-confidence result or nothing. I caught this early and now try to use the place name that would appear on a regional map, not the one that reads nicely in a caption.
The map page


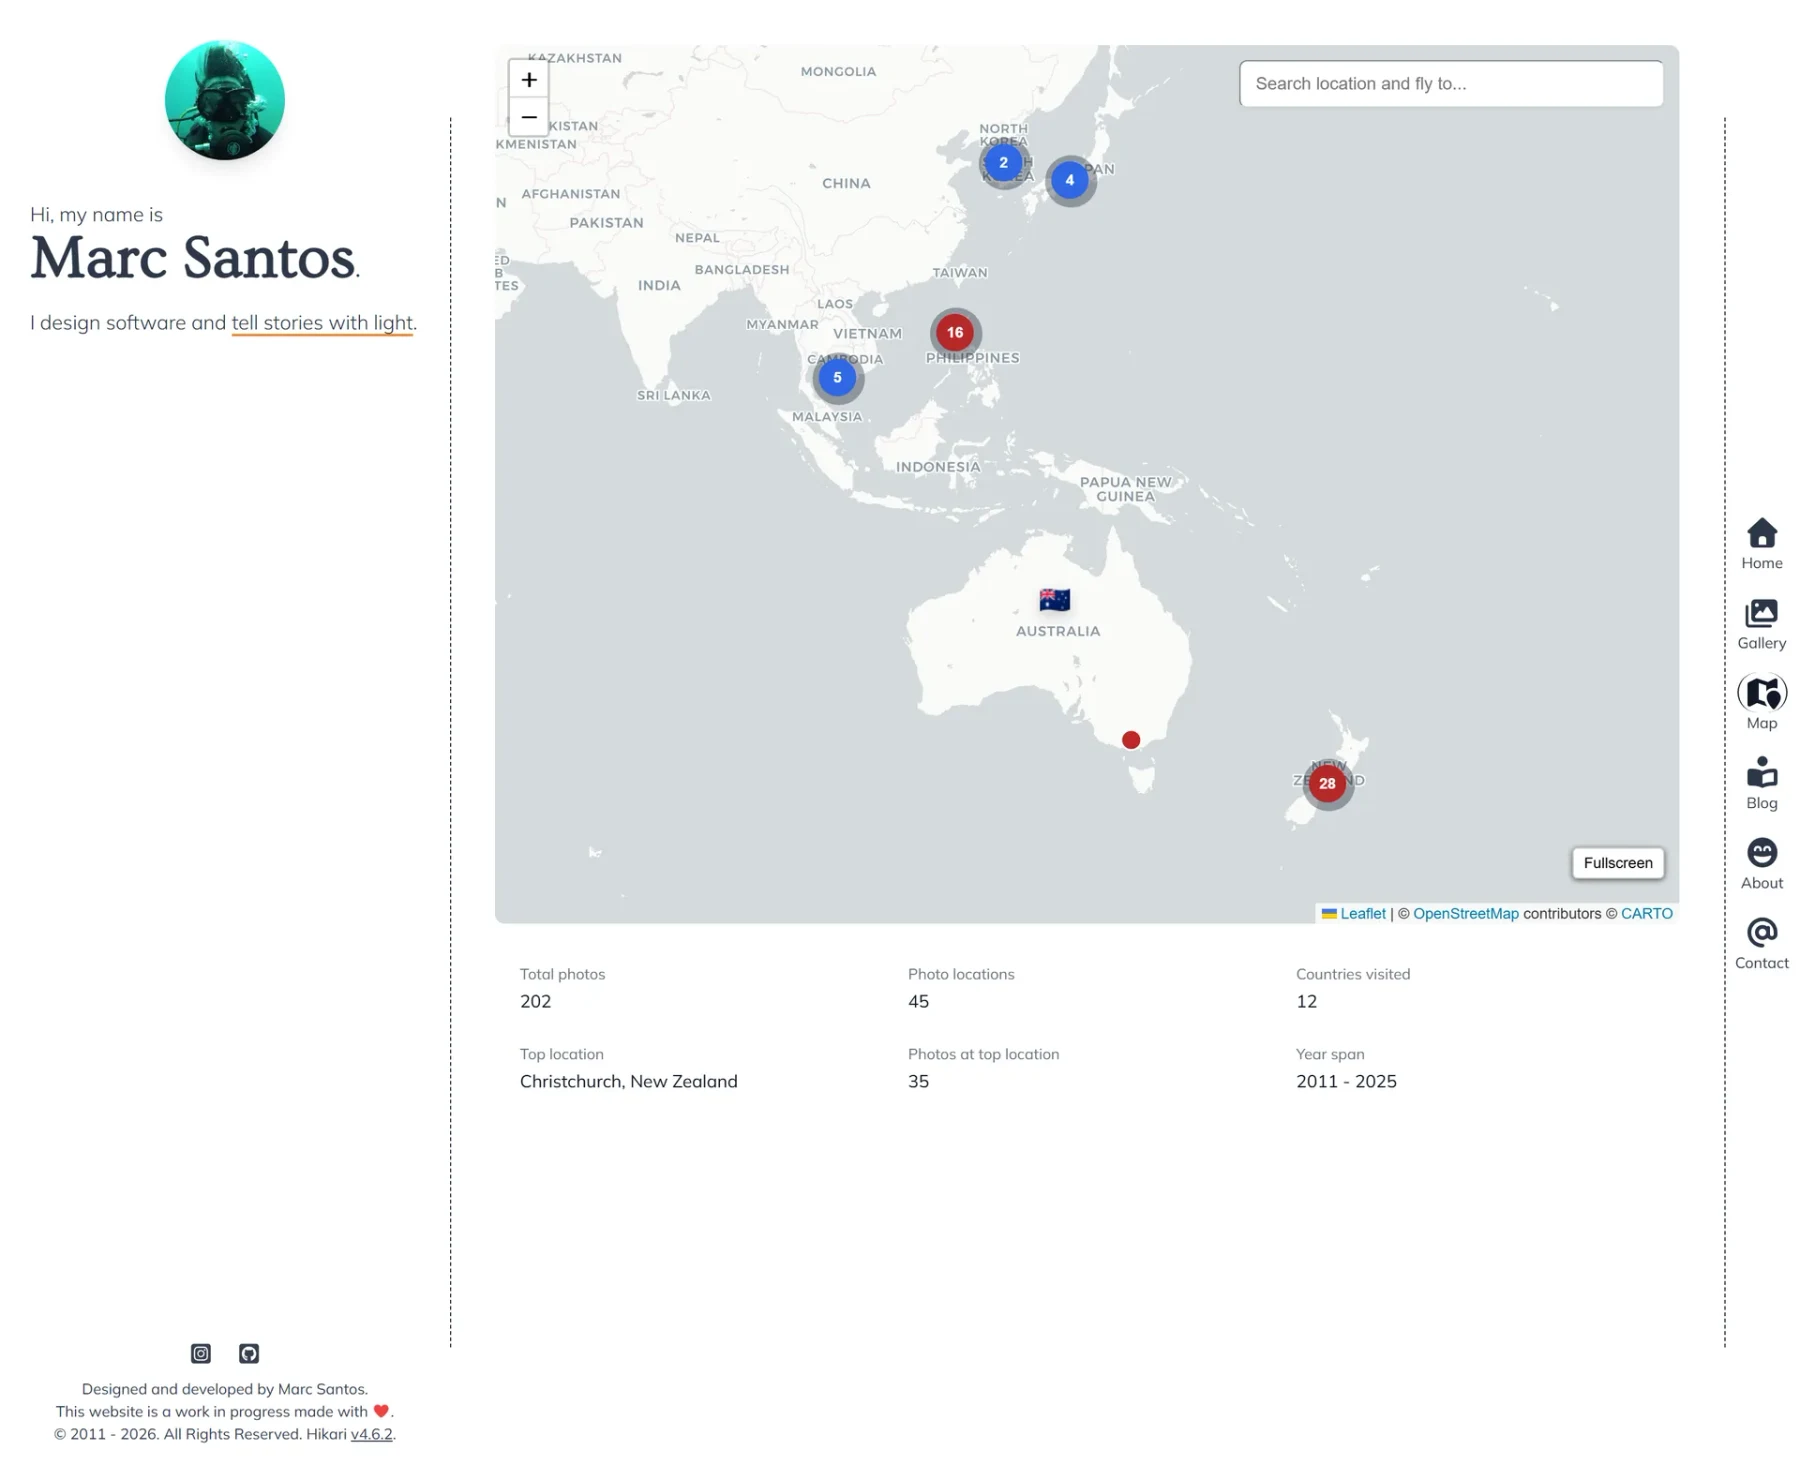

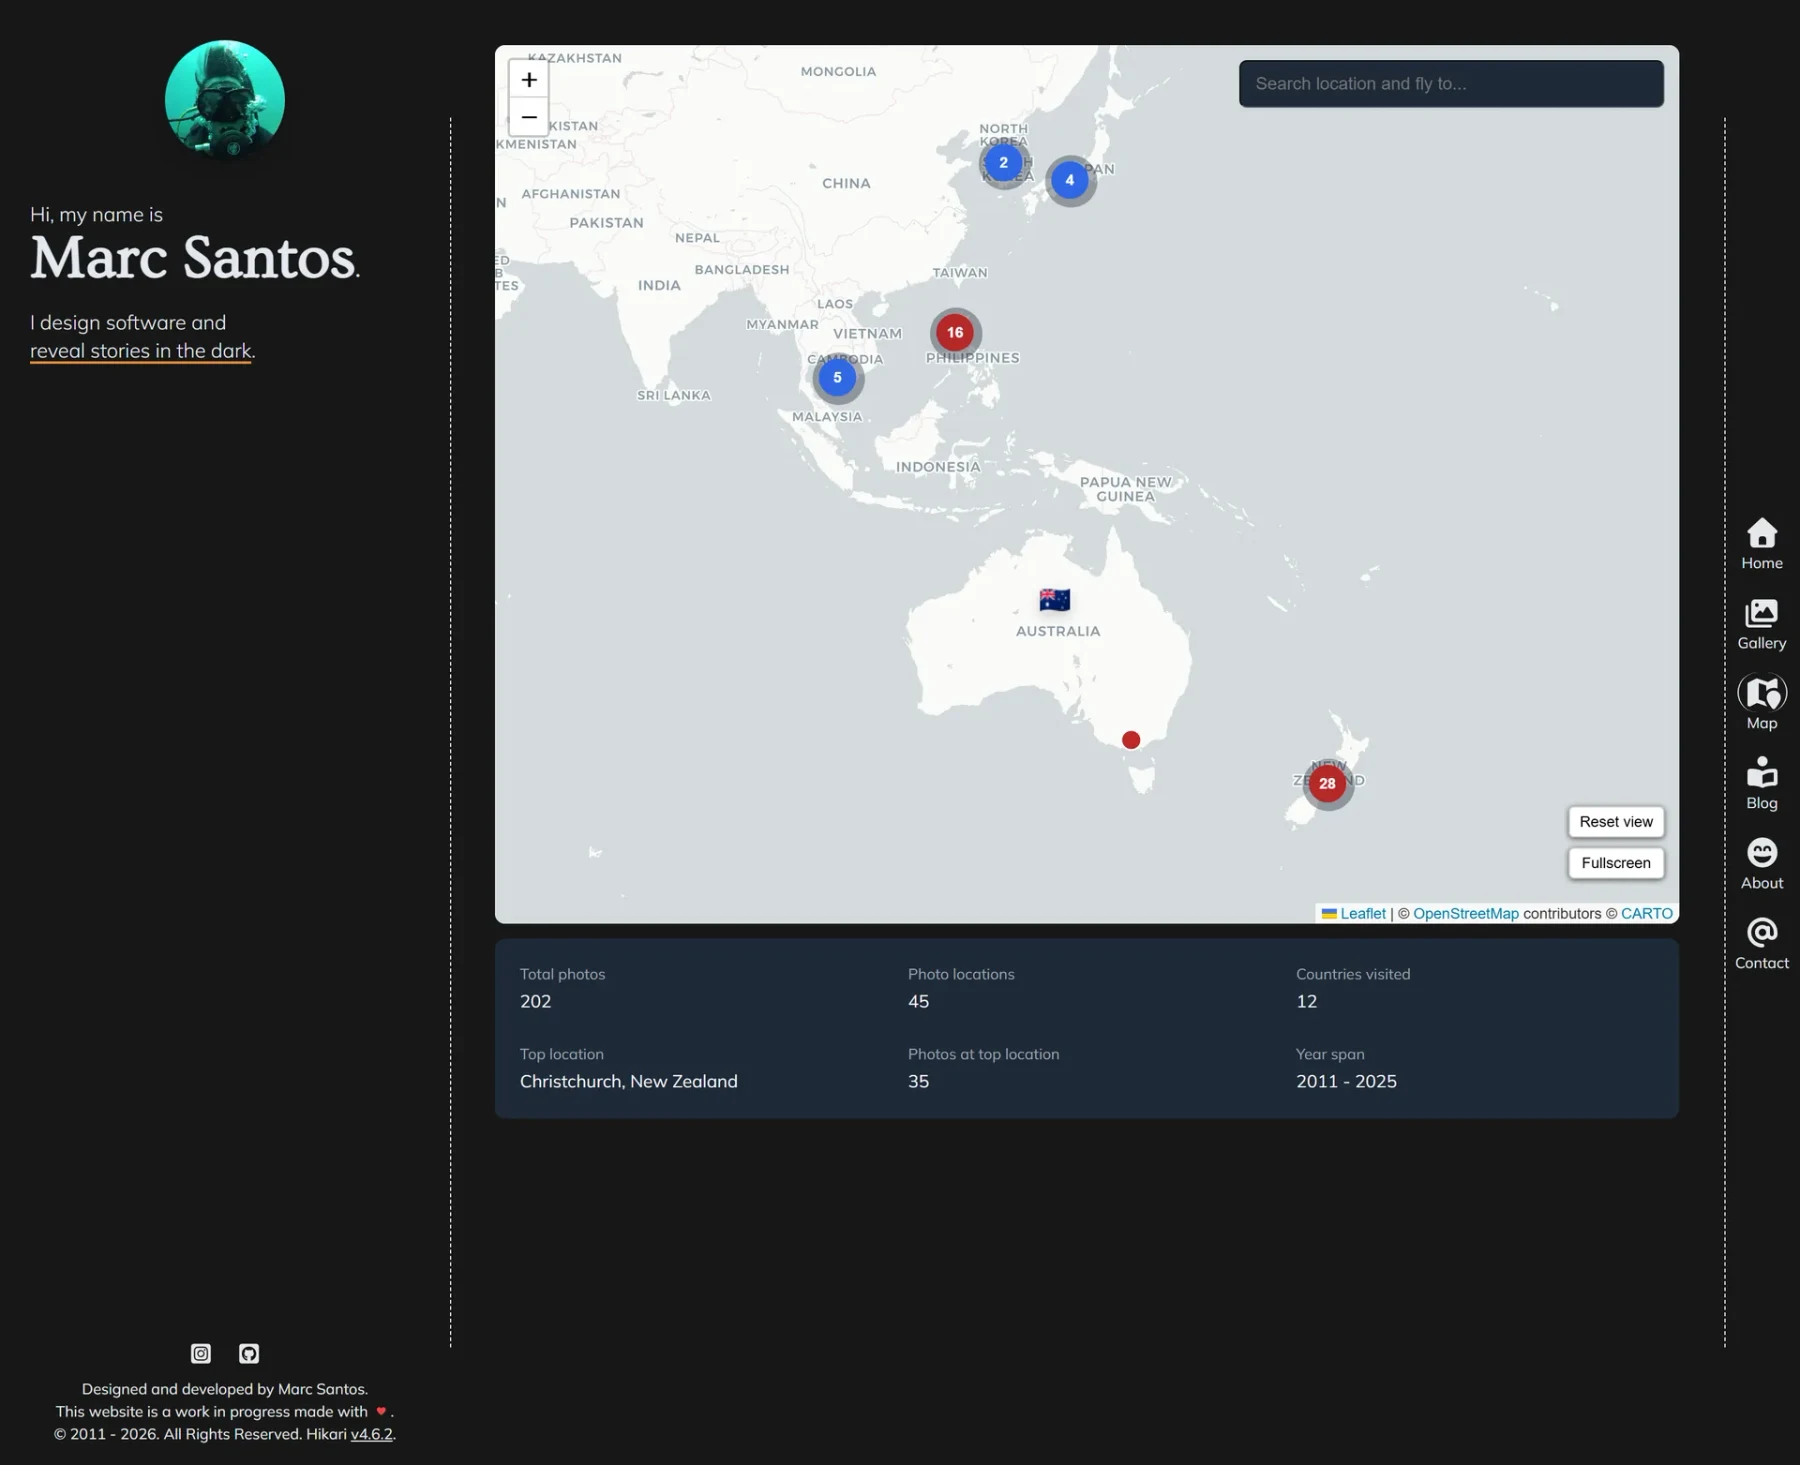
The map auto-fits bounds on load so the first view actually lands on the pins rather than the default Atlantic-centered globe. From there: search, URL state persistence, a stats panel, fullscreen, and theme-synced tiles. No layer switcher — this is a photo map, not a nav app.
The base marker setup is deliberately small:
const lightTileLayer = L.tileLayer(CARTO_LIGHT_URL, { minZoom: 0, maxZoom: 22 });
const darkTileLayer = L.tileLayer(CARTO_DARK_URL, { minZoom: 0, maxZoom: 22 });

mapLocations.forEach((entry) => {
  const marker = L.circleMarker([entry.coordinates[1], entry.coordinates[0]], {
    radius: 6,
    color: '#ffffff',
    weight: 1.4,
    fillColor: '#b91c1c',
    fillOpacity: 0.95,
  });
  const photoLabel = entry.photoCount === 1 ? 'photo' : 'photos';
  marker.bindPopup(`${entry.location} · ${entry.photoCount} ${photoLabel}`);
  marker.addTo(map);
});
This is the simplified version. The real markers use MAP_TILE_LIGHT_URL/MAP_TILE_DARK_URL constants and a dynamic radius helper. Popups also include up to 3 photo previews and a low-confidence warning when geocode quality is uncertain.
Clustering
Once I had enough pins it became visually unreadable at any zoom level that showed multiple countries. I added leaflet.markercluster and color-coded clusters by density: blue for small groups (under 6), amber for medium (6–15), red for dense zones (16+). Zoom in and they spiderfy4 cleanly. This was a straightforward add once I accepted the dependency.
Overlapping pins
Rounding coordinates creates a different problem: some locations end up with identical coordinates. Without handling this, markers just stack and you can only click the top one.
My first instinct was to add a small random jitter. I tried it. It worked visually but pin positions changed on every load, which felt sloppy and broke shareable marker links. Deterministic spread was the only real option.
The final implementation places overlapping markers in rings — 8 per ring, each ring ~560m further out, no randomness:
const spreadOverlappingLocations = (locations) => {
  const grouped = new Map();
  locations.forEach((entry) => {
    const key = `${entry.coordinates[1]}:${entry.coordinates[0]}`;
    const existing = grouped.get(key) || [];
    existing.push(entry);
    grouped.set(key, existing);
  });

  const spread = [];
  grouped.forEach((group) => {
    if (group.length === 1) {
      spread.push(group[0]);
      return;
    }

    group.forEach((entry, index) => {
      const ring = Math.floor(index / 8) + 1;
      const indexInRing = index % 8;
      const angle = (indexInRing / 8) * Math.PI * 2;
      const offset = ring * 0.005; // ~560m per ring

      spread.push({
        ...entry,
        coordinates: [
          entry.coordinates[0] + Math.cos(angle) * offset,
          entry.coordinates[1] + Math.sin(angle) * offset,
        ],
        hasAdjustedPosition: true,
      });
    });
  });
  return spread;
};
Pin order is always the same, so deep links stay stable.
Mobile and keyboard interaction
Touch devices can't hover, which broke my first popup implementation entirely — it opened on mouseenter and never fired on mobile. The fix was straightforward in retrospect: tap-to-open on mobile detected via window.matchMedia('(hover: none), (pointer: coarse)'), with Enter/Space support on desktop and Escape to close. Tab navigation through markers as you'd expect from any interactive element.
I should have thought about this before building the hover behavior. I didn't.
Photo preview popups


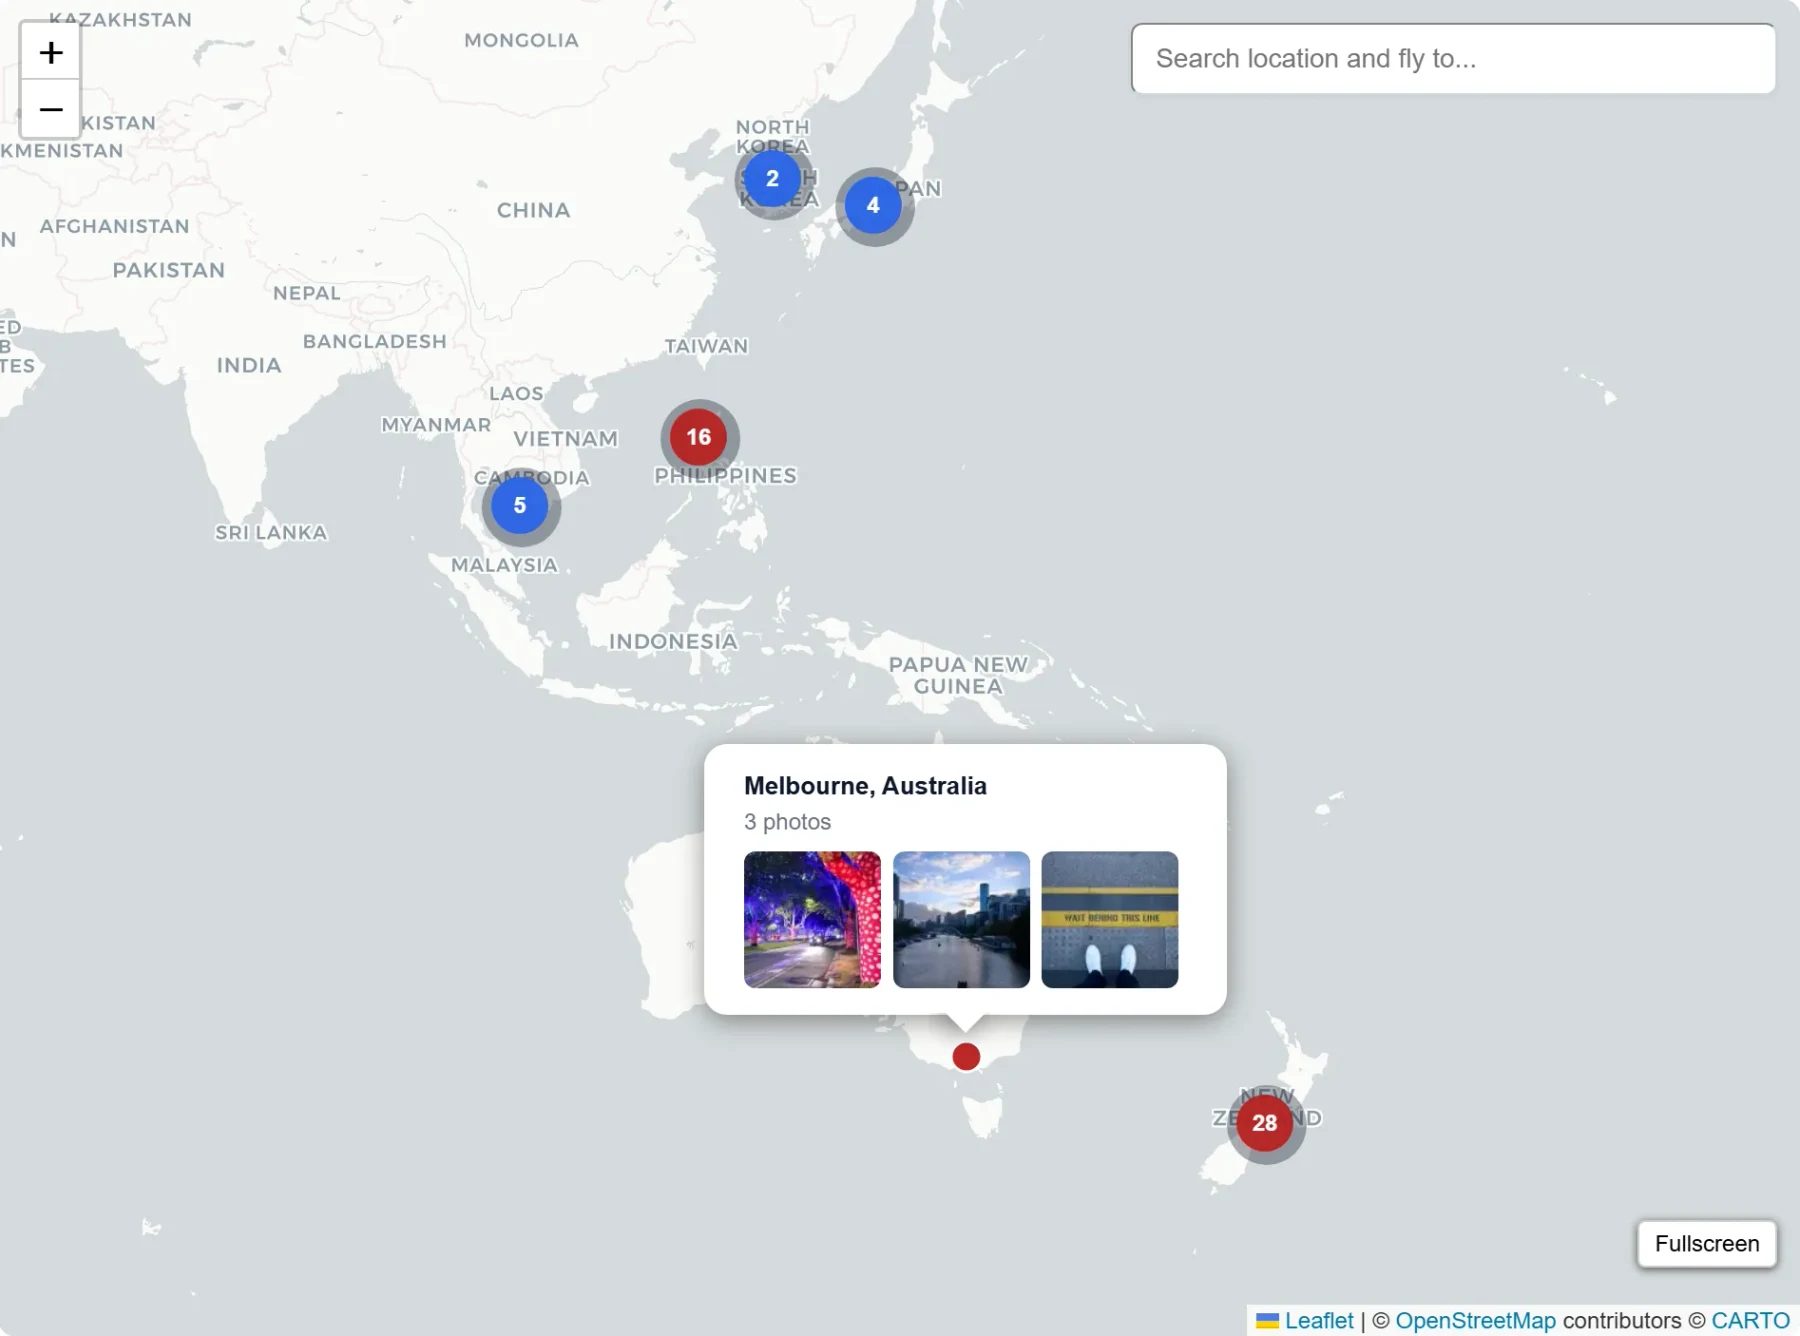
Hovering (or tapping) a marker shows a 3-image grid from that location, the location name, and a photo count. Images are Gatsby Sharp WebP transforms so they're optimised. Low-confidence geocodes show an orange note below the grid.
Travel pins
The map also pulls in countries from travel.json and renders them as small flag icons. Popup shows visit count rather than photo previews. Merging two data sources (photo locations and travel records) into one map felt right — they're describing the same thing from different angles.
Search and URL state

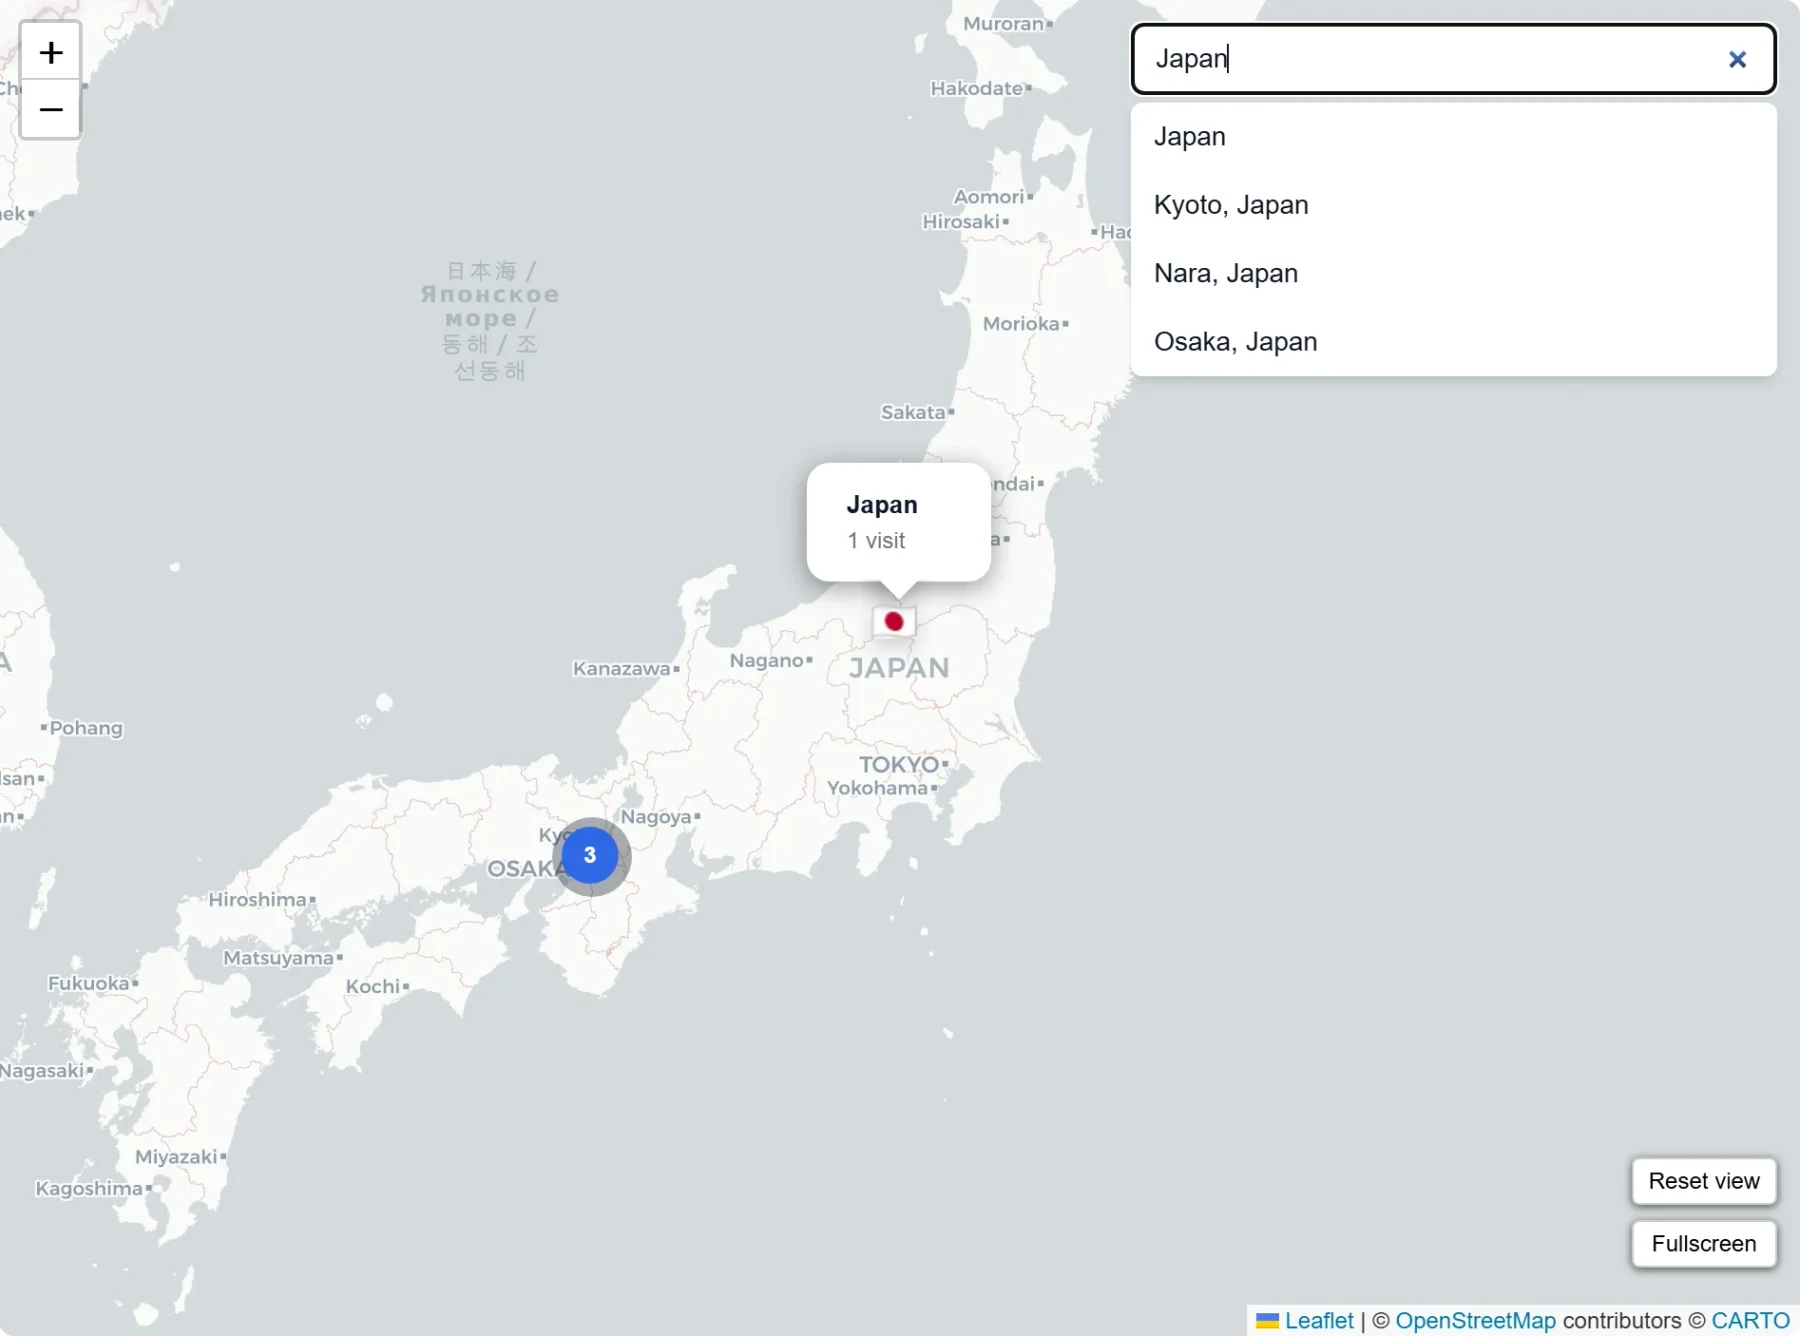
Search sits top-right, collapses on mobile, and supports full keyboard navigation (ArrowUp, ArrowDown, Enter, Escape). Selecting a result flies the map to that location and opens its popup.
Map position and zoom persist in URL params (lat, lng, z). Opening a marker sets a marker param. This means you can share a direct link to any pin, which turned out to be more useful than I expected when cross-referencing photos with a specific place.
Reset view
A small reset button appears only after you've panned or zoomed away from the initial fit-bounds view. It resets map state and search, then hides itself again. I tried always showing it — it was distracting. Only showing it when it's actually useful was the better call.
Stats and fullscreen
Below the map: total photos, photo location count, countries visited, top location, year span, and a pending geocode count when any locations are still waiting. A fullscreen toggle in the map controls expands the view for focused browsing.
Geocode confidence
Nominatim returns importance and place_rank fields. I classify each geocode:
- High:
importance >= 0.55; fallback toplace_rank >= 16if importance is missing (cities, landmarks) - Medium:
importance >= 0.25; fallback toplace_rank >= 10(towns, regions) - Low: everything else (villages, ambiguous names)
- Unknown: missing data

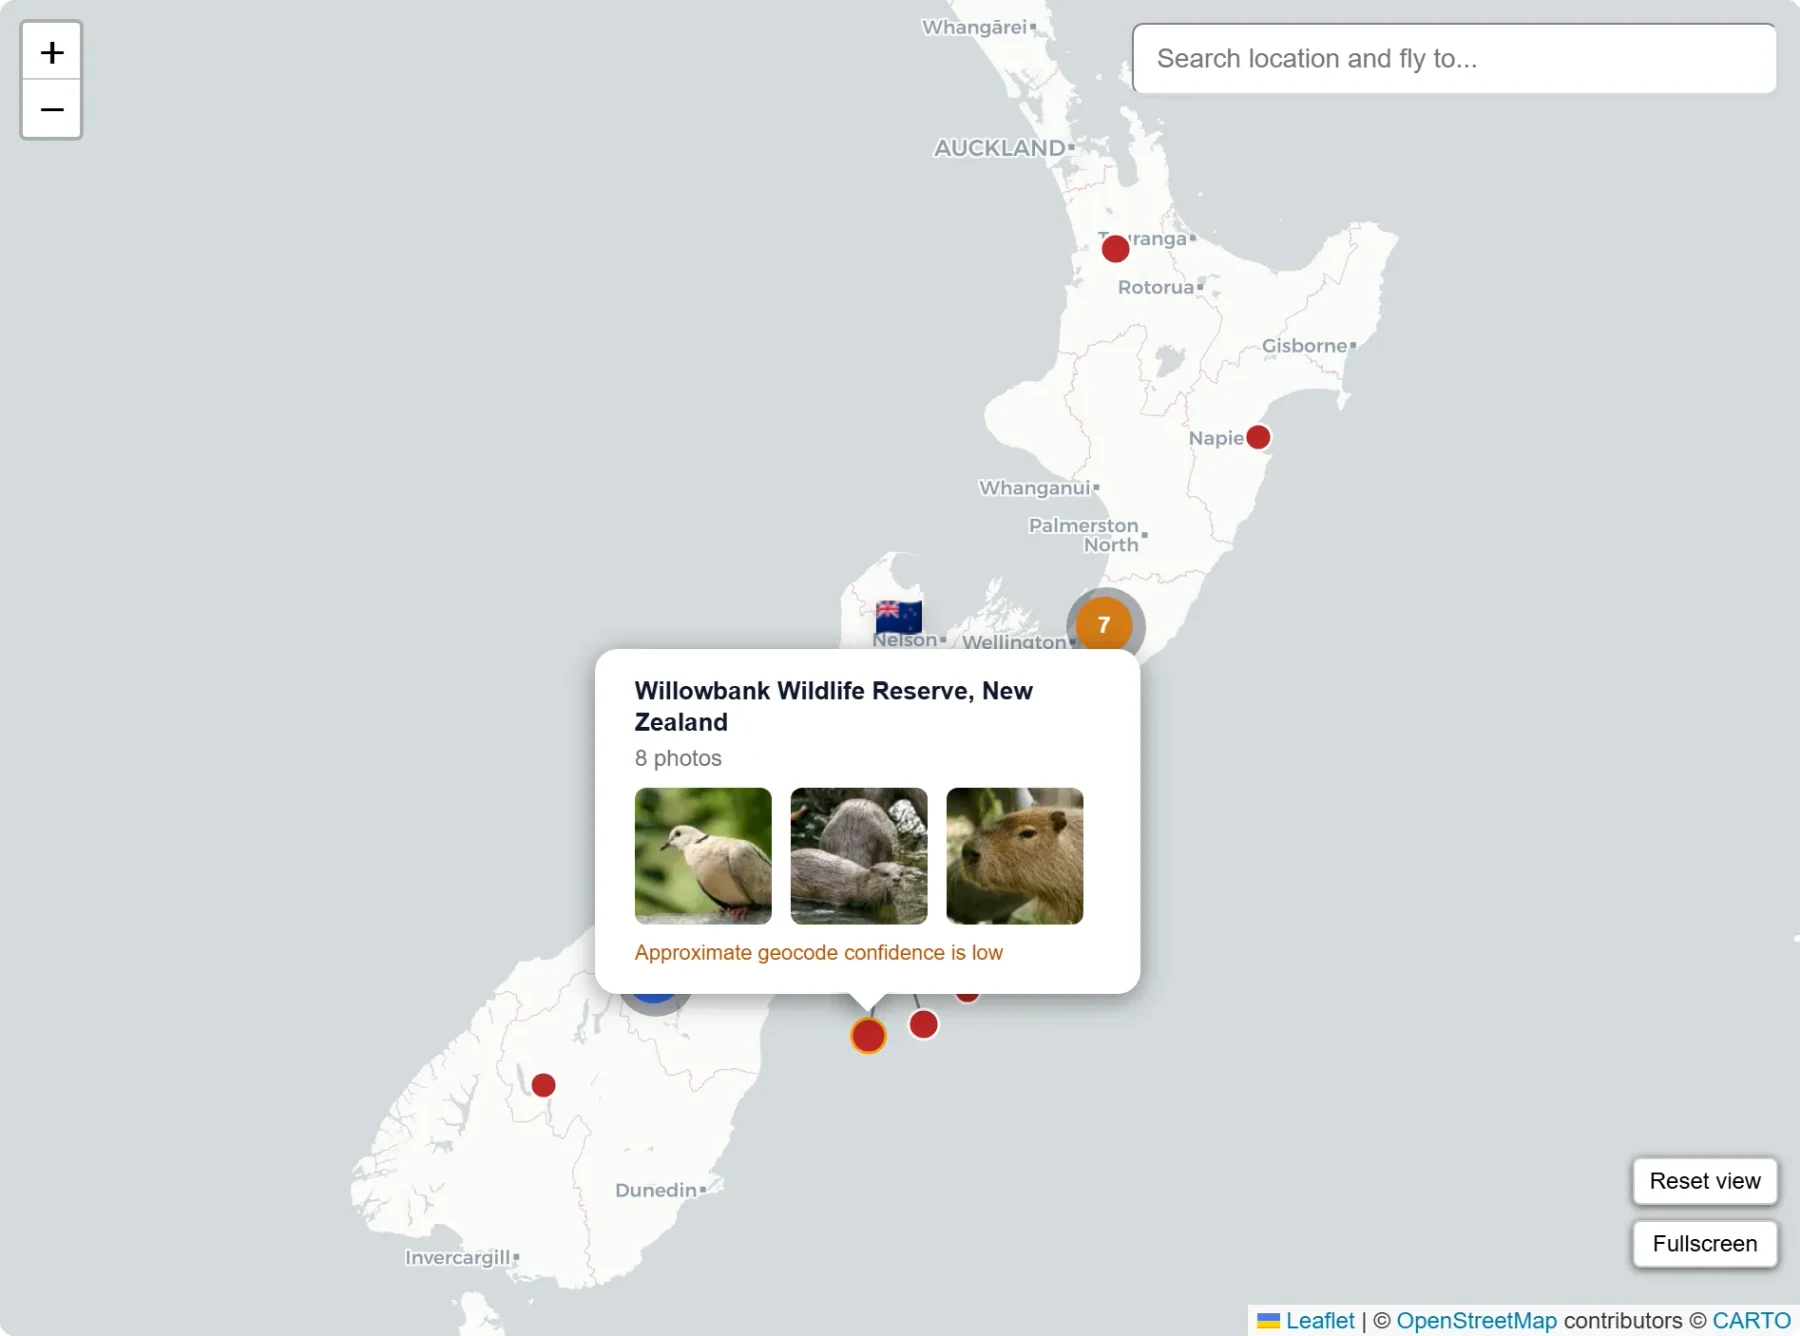
Low-confidence pins get an orange border and a note in the popup. This matters because a pin that landed in the wrong province is worse than no pin — at least with the warning you know to treat it skeptically.
Performance
Popup HTML and ARIA labels5 are memoized6 via useMemo — computed once per page load, not once per marker interaction. Device detection is cached once on mount. Neither is a dramatic optimisation but the map goes from blank to interactive faster, especially with a large number of pins.
The two things that actually surprised me
I expected to hit API limits, styling edge cases, and mobile quirks. I did. The two things I didn't anticipate:
Cache drift. When a location string in captions.json changes, the old key stays in the cache indefinitely. I hit this when correcting a few location names and wondered why the map was still showing old positions. The fix was to prune the cache to match current captions on every geocoding run — stale keys get removed automatically now.
How thoroughly paid tiles dominate. I knew Mapbox charged. I didn't appreciate until I was deep in the tile research how many of the visually distinctive styles you see in the wild require an API key or have usage limits that look generous until they aren't. Carto's free attribution tiles were the deciding factor.
Refreshing locations
When captions change:
npm run geocode:locations
If the map flags a location as pending geocoding, the location string in captions.json almost certainly needs to be more specific. The cache keeps production fast — rebuilds don't re-geocode anything that hasn't changed.
Where it ended up
What started as one pin per location became something more complete than I intended. The parts I'm most glad I added were the overlap spread algorithm, the geocode confidence classification, and URL state persistence.
The parts still on the list when time allows:
- A gallery drawer showing all photos from a selected location
- Timeline/date filtering for browsing by period
- Tag-based filtering for map exploration
None of them are urgent. The map is calm and fast and does what it needs to do.
You can see it at /map.
Footnotes
-
Geocoding is the process of converting a place name or address into map coordinates (latitude/longitude). ↩
-
Deterministic builds produce the same output from the same input data, which makes deploys more predictable. ↩
-
Carto's basemap tiles are free to use with attribution; the credit line needs to remain visible. https://carto.com/attributions ↩
-
Spiderfying is the map behavior that fans overlapping markers outward so each one can be clicked individually. ↩
-
ARIA labels are accessibility text used by assistive technologies (such as screen readers) to describe interactive elements. ↩
-
Memoized means a computed result is cached and reused instead of recalculated on every render. ↩